When Joel Bock isn’t busy building fraud detection models to detect identity thieves like the ones that steal $6 billion a year filing phony tax returns, he uses his skills for his other passion – football analytics.
Joel is a fraud data scientist by day analyzing massive sets of fraud data, identifying predictive fraud variables, and then using techniques like gradient boosting to codify a perfect fraud detection machine. Those machines (or models as we call them) are used millions of times a year to predict which transactions are likely to be fraud before money is sent to potential fraudsters.
By night, he uses his skills to analyze football. Because like the movie MoneyBall, he believes number crunching is the future of the game.
Predicting NFL Turnovers Empirically
Turnovers are a big deal in the NFL. And teams watch them like a hawk.
Why? Because statistics show that teams that have fewer turnovers in a game win 70% of the time. Fewer turnovers lead to more wins. More wins lead to more money.
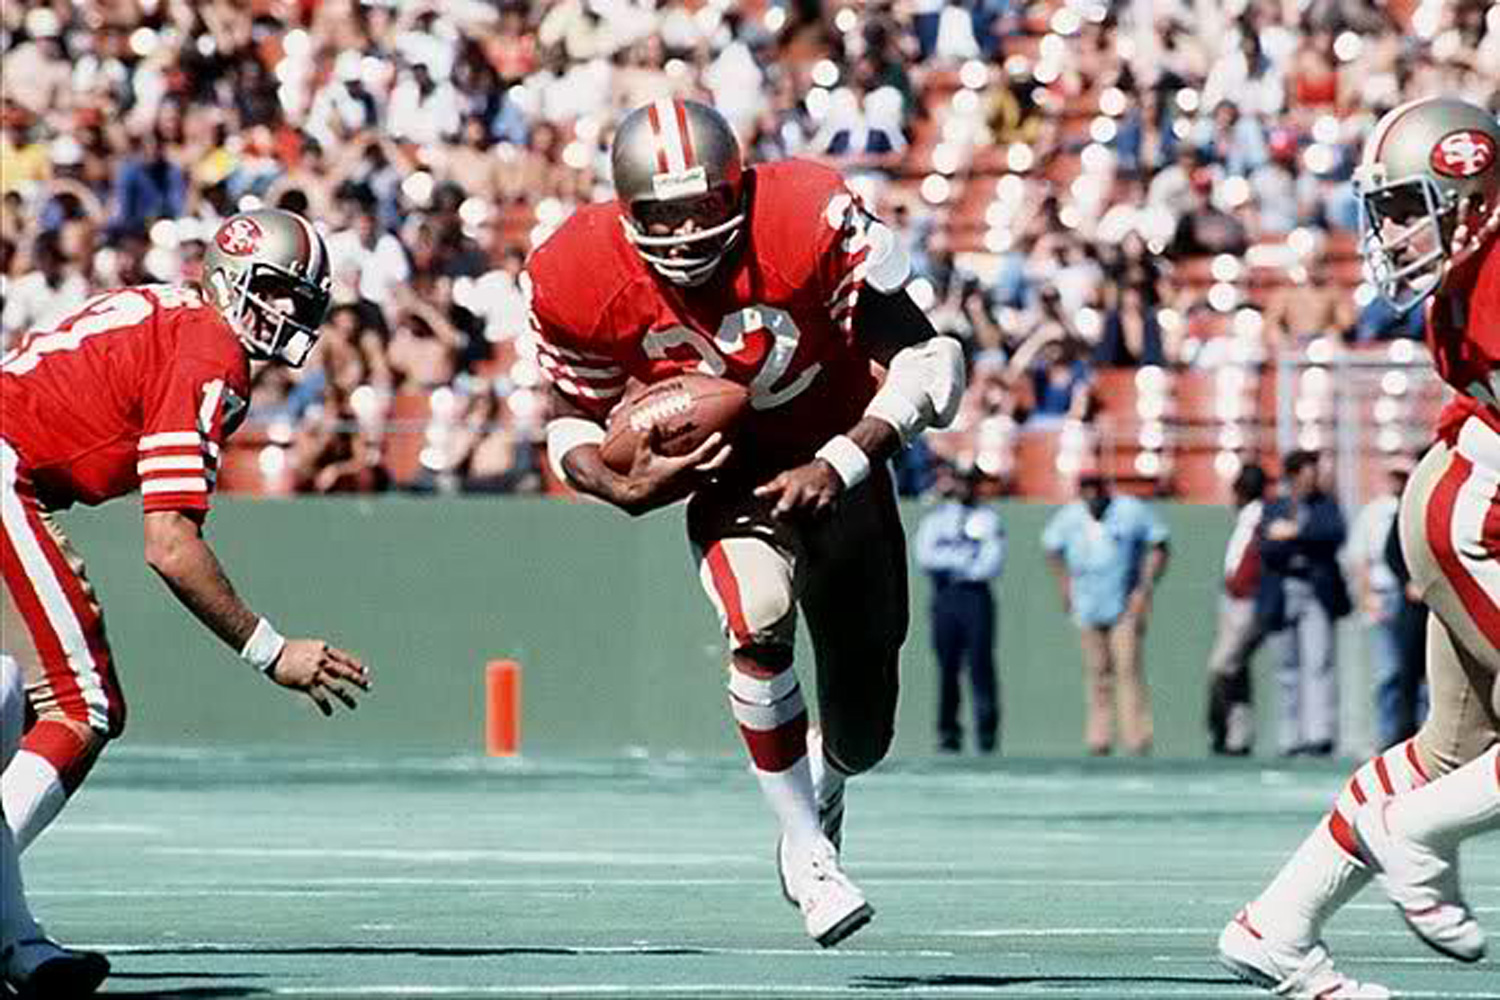
Here’s a prime example of why turnovers matter. In 1978, the 49ers set an NFL record 63 turnovers in a single season and they had the worst record in the league going 2-14.
By 1981, they turned the team around going 13-3 and winning the Super Bowl. Their turnover ratio that year – Zero.
OJ Simpson finished out his career with the lowly 1978 San Francisco 49ers.
With so much on the line, is it possible to build a model to help teams predict when they might turn over the ball so that they could take preventative measures? Surely Bill Belichick and the Patriots would be interested in something like that.
As it turns out, Joel thinks that it is and he has proved it is possible in his new scientific study called Empirical Predictions of Turnovers in the NFL.
His analysis determined that under certain conditions, both fumbles and interceptions can be predicted with low false discovery rates (less than 15%). That was pretty amazing. With his data model, he can correctly predict 85% of the time when a turnover is likely to occur. I doubt any head coach in the NFL could do that.
Joel’s Detection Model can predict if a turnover is likely to occur 85% of the time.
And many of the techniques and principals he used to make this discovery were the same techniques he used to find fraudsters.
3 Key Learnings from His Analysis
Predicting NFL Turnovers is Like Trying to Predict Fraud
According to Joel, turnovers are a rare event in the NFL. Only 3% of passes are intercepted and less than 1% of rushing plays end in a fumble.
But when they do happen, they are costly, even catastrophic, for a football team. Like fraud, which is extremely rare and costly – only 1 in 2000 card transactions are fraud but cause $700 in losses to the bank for each case – there is a huge reward for being able to predict them.
To analyze such rare but costly events you need lots of data. So Joel turned to NFL.com and downloaded 7 years of data covering all 32 NFL teams. To be able to build a predictive model on rare events he used over 300,000 plays and their outcomes.
More Risk Equals More Desperation Equals More Turnovers
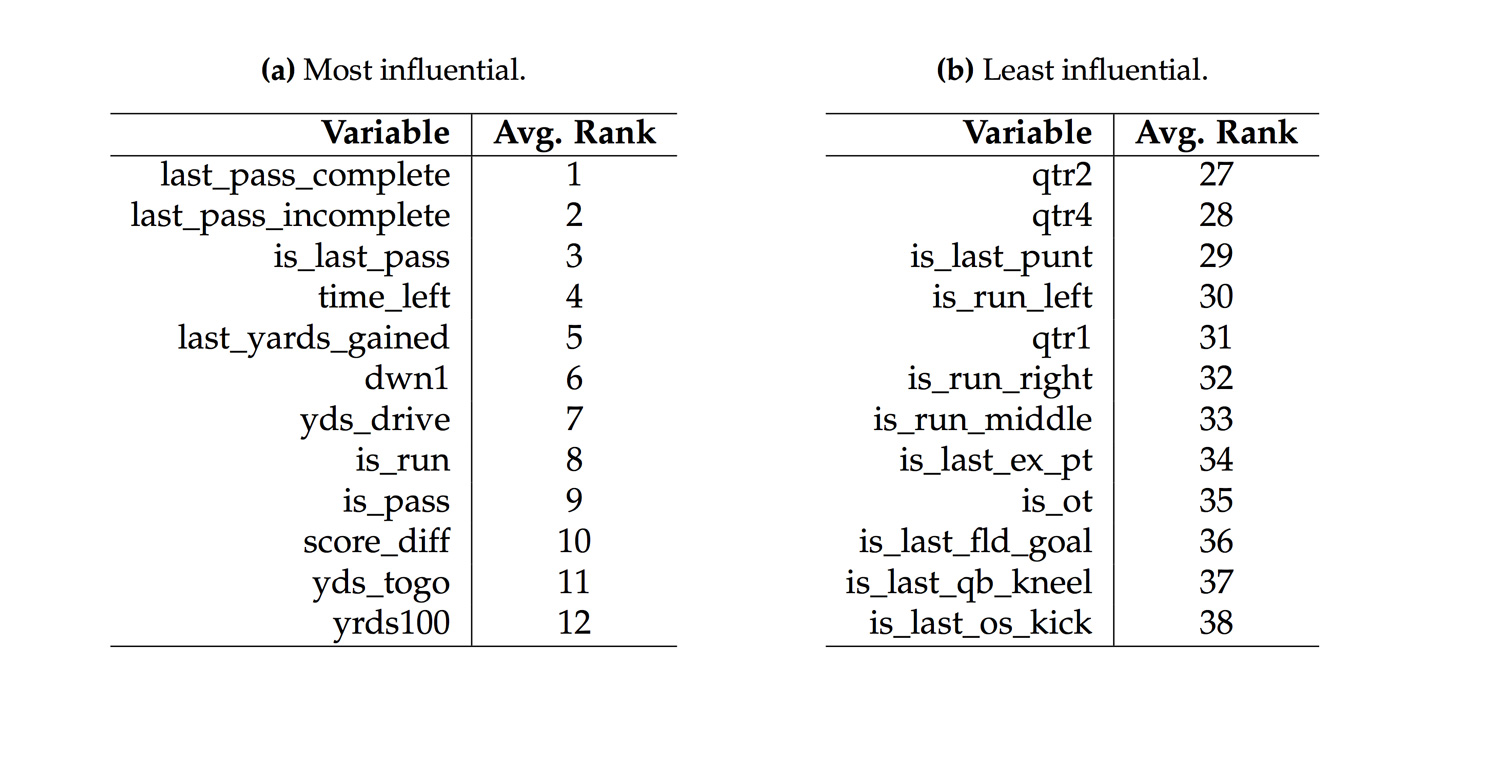
Joel found that some variables were stronger predictors of whether a team would fumble and they seem to point to the fact that teams may be more likely to fumble when they take greater risk.
Take a look at the strongest and weakest variables, I think they tell a compelling story.
Segmentation was Key in Predicting Performance
One of the key takeaways from Joel’s study was segmentation. To predict fumbles, he needed to create 3 separate model segments to analyze the risk differently. Run, Run or Pass, and Pass. By analyzing the dynamics differently, he was able to get better prediction.
This is something we have been using in fraud detection modeling for years. For example, we create the following segments in card models to boost prediction
- High Dollar Verse Low Dollar Transaction
- Domestic Verse International Transaction
- Card Present Verse Card Not Present Transaction
- In Customer Home Area Verse Out of Customer Area
- High-Risk Merchant Verse Low-Risk Merchant
Segmentation is used to create many separate specialist models that are then used in the final prediction. In fraud modeling, we can boost detection by 30% or more with good segmentation.
Detecting Fraud and Detecting Fumbles Is Not All That Different
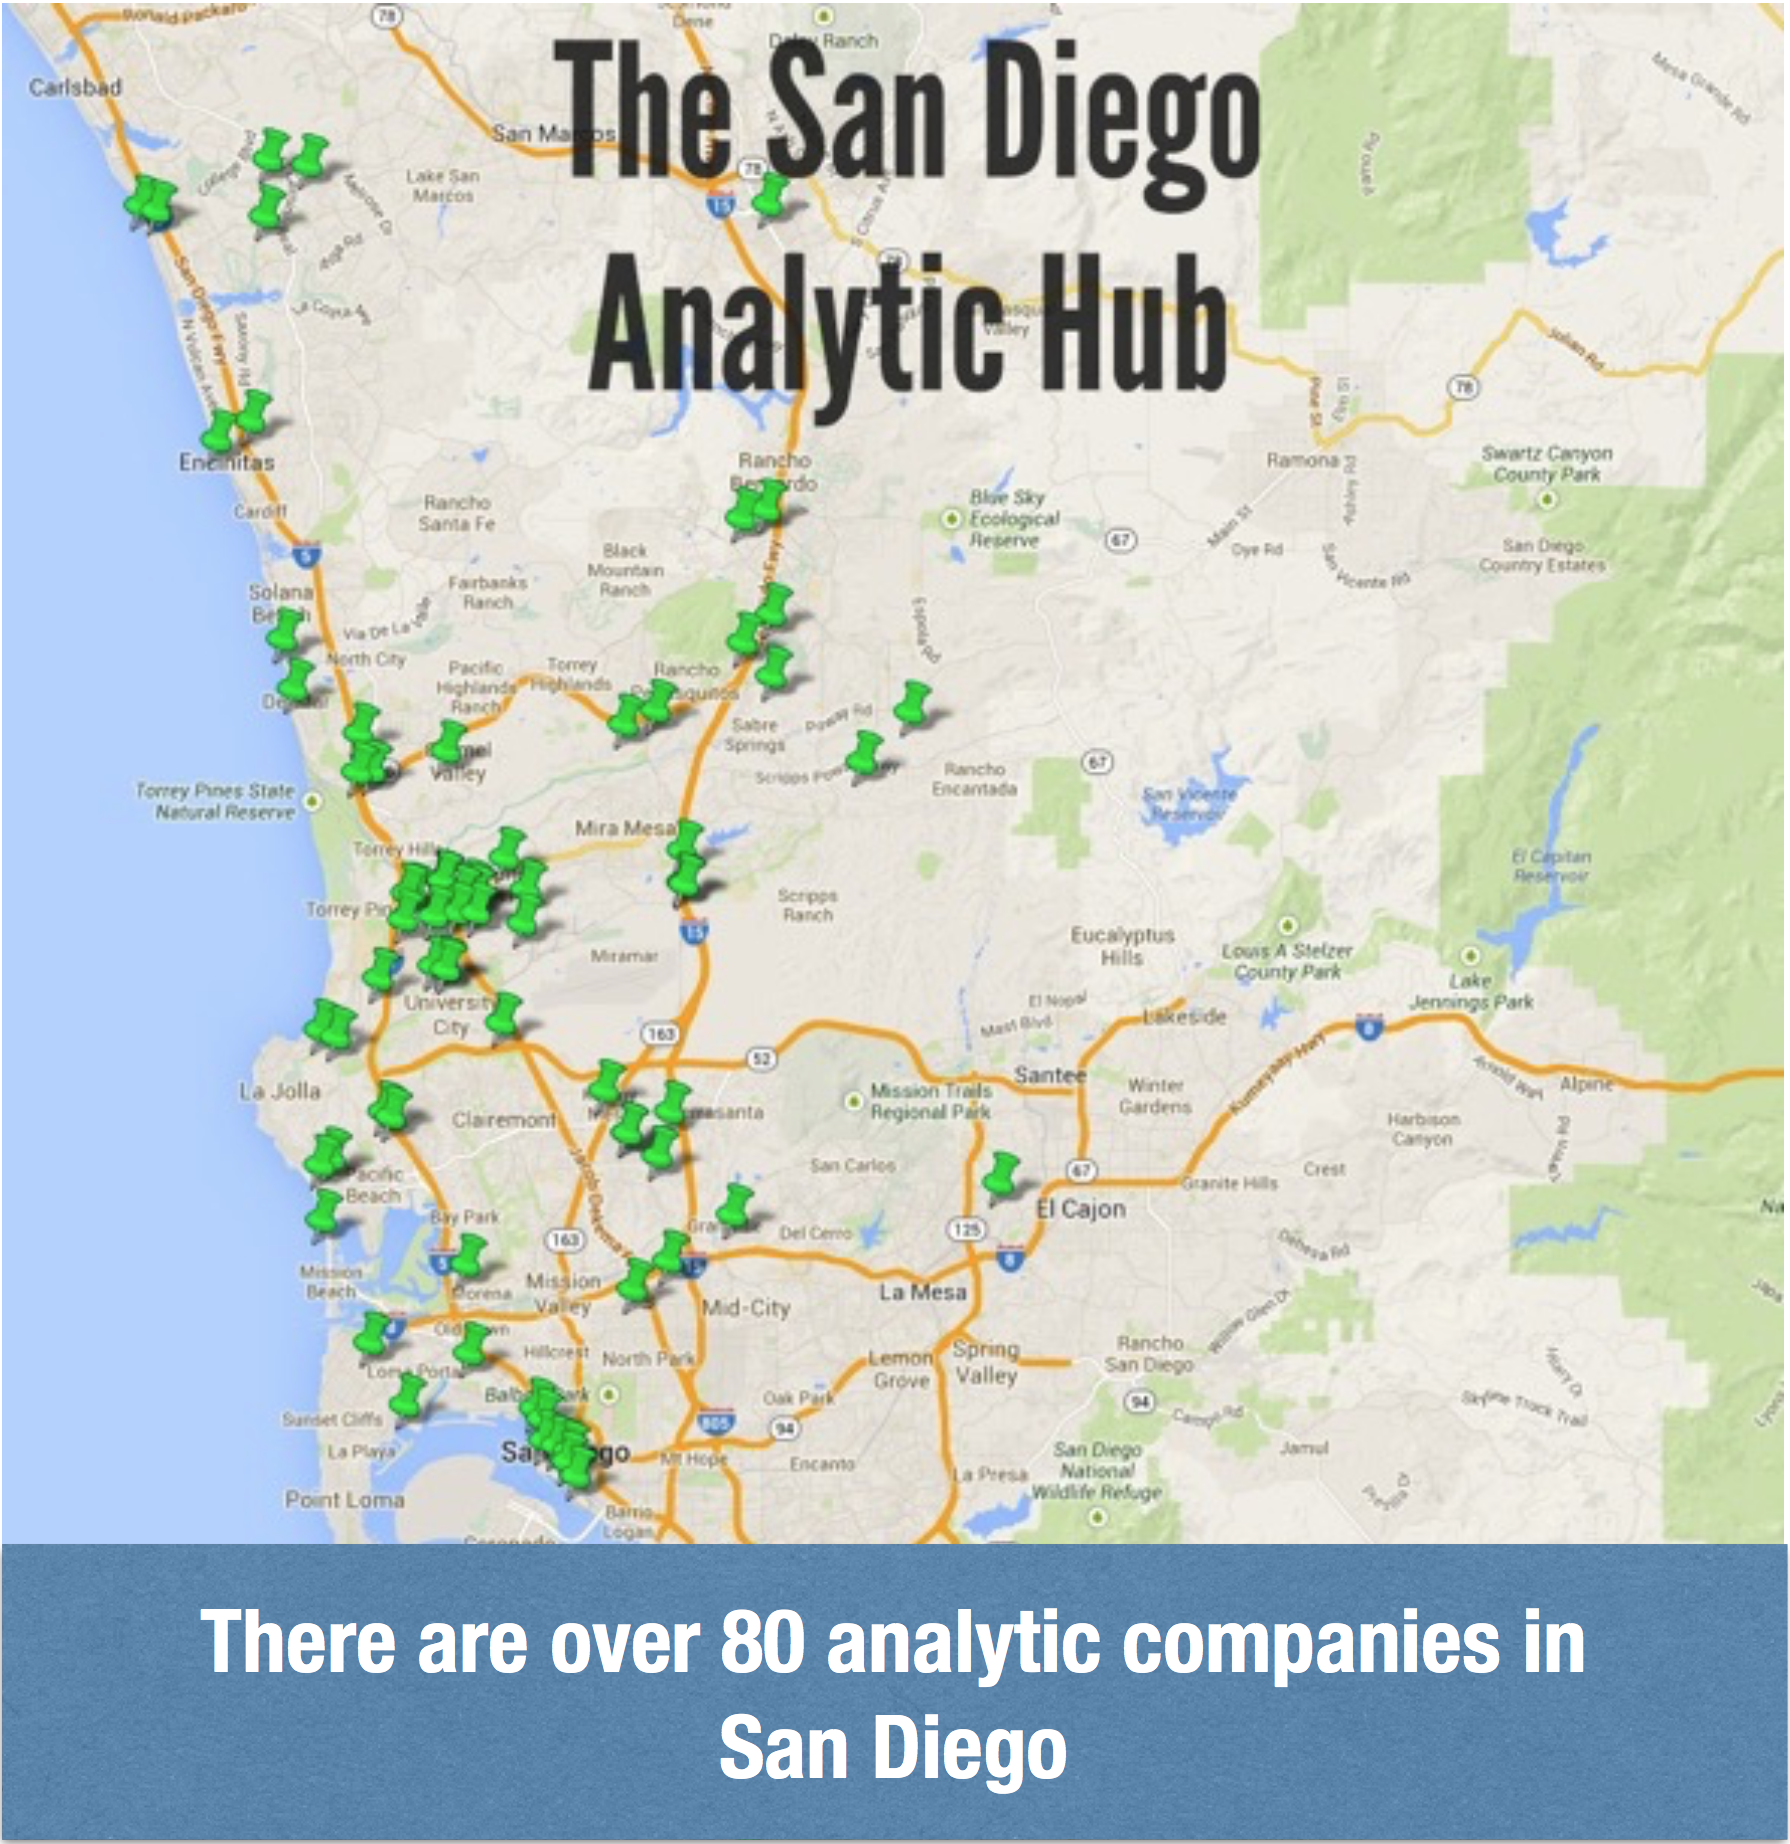
Data analytics is big business and growing. There are more than 80 analytic companies based in San Diego and the number is growing every year. PayPal, Amazon, Google and other companies are all opening analytic offices in San Diego. San Diego is a center for analytic innovation and that’s why PointPredictive maintains our offices here.
And it all started here because of HNC Software which emerged in the 1990’s to build fraud models for banks.
It’s great to see that innovation in fraud analytics is now being broadly used to help other industries solve problems.
Check out Joel’s study and give him your thoughts on it. I am sure he would love to get your feedback.


